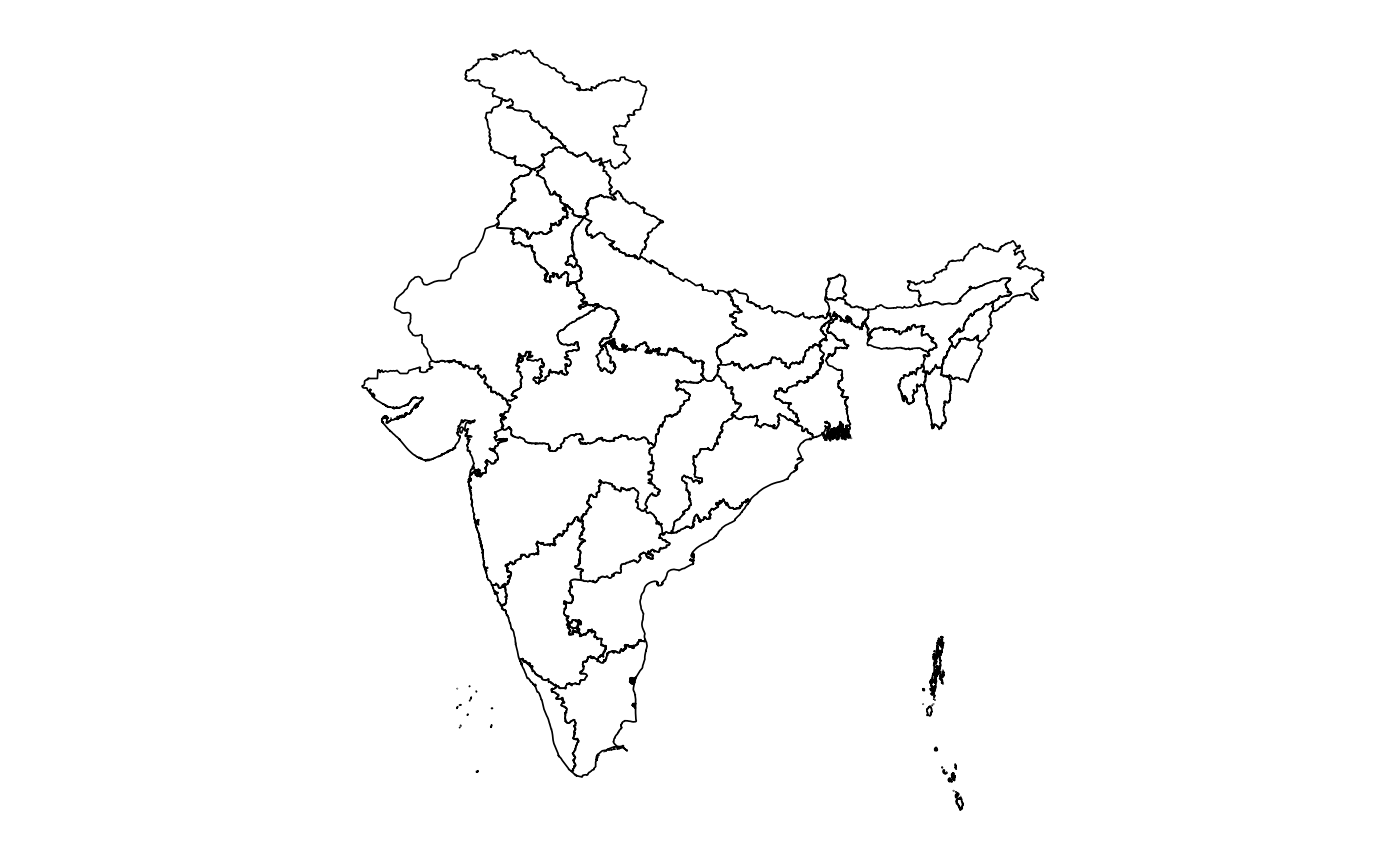
Conveniently plot basic India map
Usage
plot_india(
  regions = c("states", "state", "districts", "district"),
  include = c(),
  exclude = c(),
  data = data.frame(),
  values = "values",
  theme = theme_map(),
  labels = FALSE,
  label_color = "black",
  label_size = 4,
  ...
)
Arguments
- regions
The region breakdown for the map, can be one of (
"states","state","districts","district"). The default is"states".- include
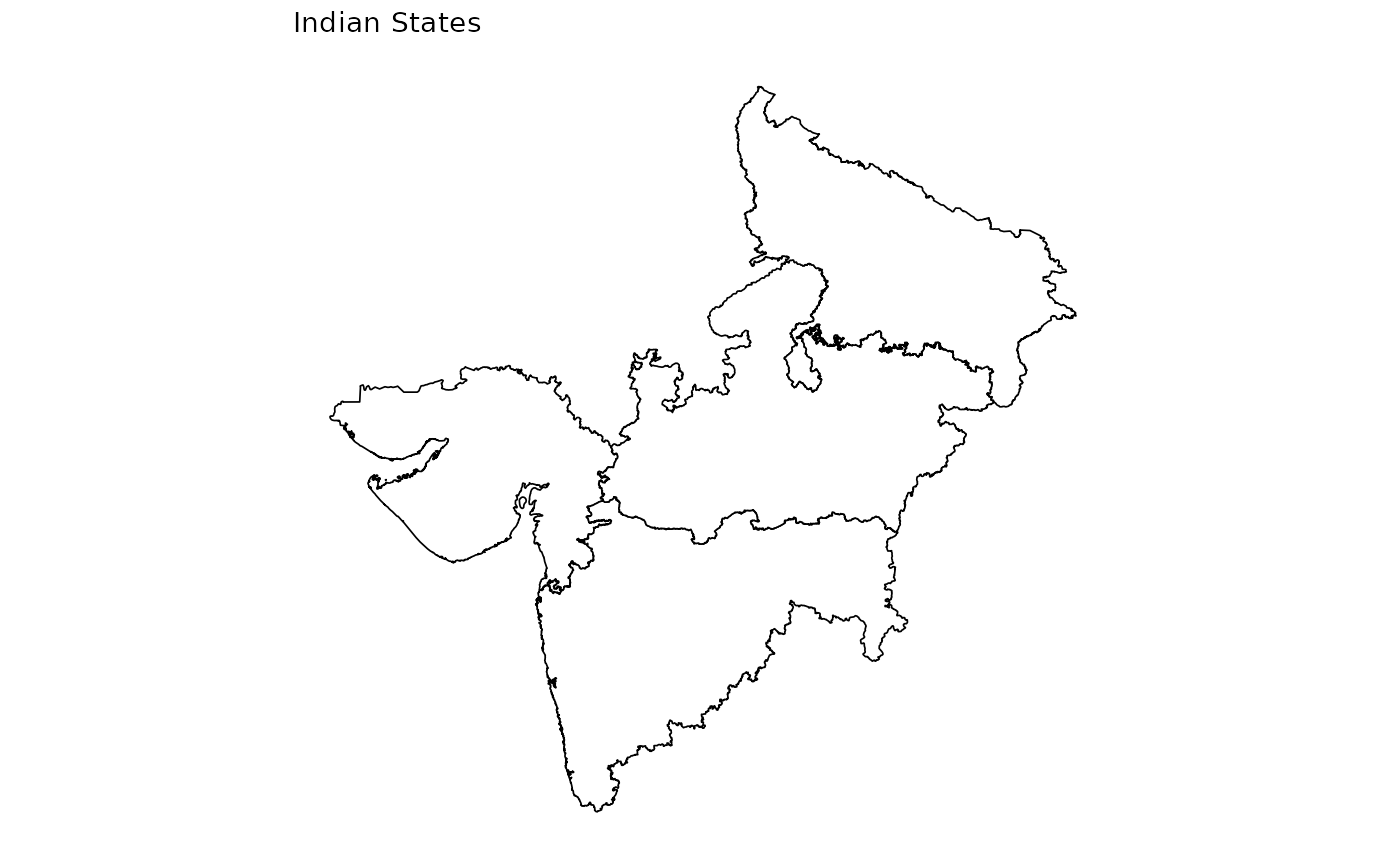
The regions to include in the resulting map. If
regionsis"states"/"state", the value can be either a state name, abbreviation or code. For districts, the district codes must be provided as there can be multiple districts with the same name. If states are provided in the districts map, only districts in the included states will be returned.- exclude
The regions to exclude in the resulting map. If
regionsis"states"/"state", the value can be either a state name, abbreviation or code. For districts, the district codes must be provided as there can be multiple districts with the same name. The regions listed in theincludeparameter are applied first and theexcluderegions are then removed from the resulting map. Any excluded regions not present in the included regions will be ignored.- data
A data frame containing values to plot on the map. This parameter should be a data frame consisting of two columns, a code (2 characters for state, 3 characters for district) and the value that should be associated with that region. The columns of
datamust becodeorstateand the value of the `values` parameter.- values
The name of the column that contains the values to be associated with a given region. The default is
"value".- theme
The theme that should be used for plotting the map. The default is
theme_mapfrom ggthemes.- labels
Whether or not to display labels on the map. Labels are not displayed by default.
- label_color
The color of the labels to display. Corresponds to the
coloroption in the [ggplot2::aes()] mapping. The default is"black".- label_size
The size of the labels to display. Corresponds to the
sizeoption in the [ggplot2::aes()] mapping. The default is4. for more color options.- ...
Other arguments to pass to [ggplot2::aes()]. These are often aesthetics, used to set an aesthetic to a fixed value, like
color = "red"orlinewidth = 3. They affect the appearance of the polygons used to render the map (for example fill color, line color, line thickness, etc.). If any ofcolor/colour,fill, orlinewidthare not specified they are set to their default values ofcolor="black",fill="white", andlinewidth=0.4.